
Tutorial on Visualization in Multiobjective Optimization
B. Filipič, T. Tušar
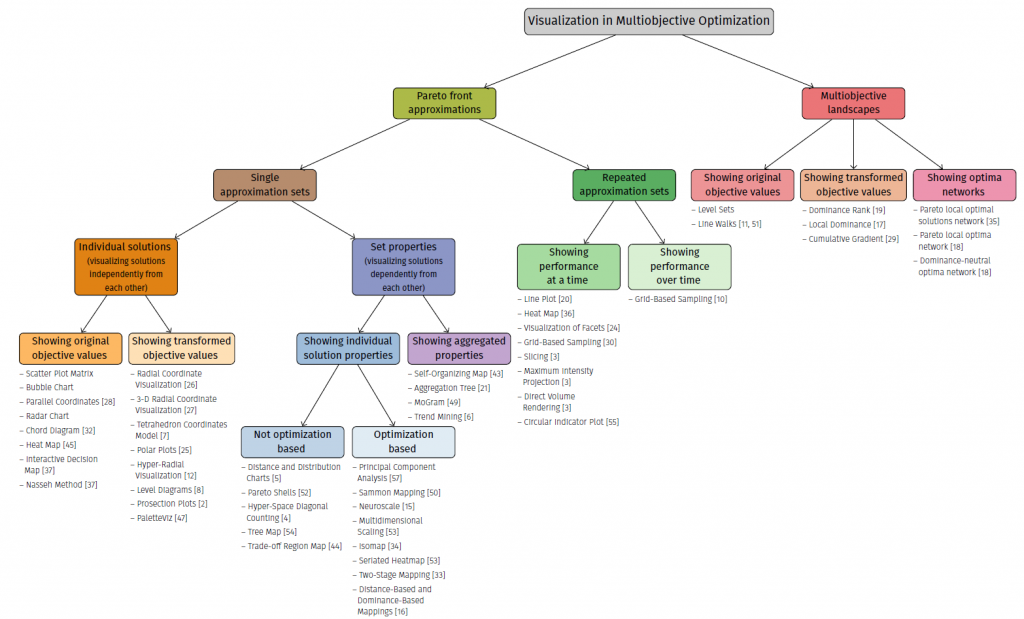
This tutorial provides an overview of representative methods used in multiobjective optimization for visualizing: (1) individual approximation sets resulting from a single algorithm run, (2) multiple approximation sets stemming from repeated runs, and (3) multiobjective problem landscapes.
The methods are organized according to our recently proposed taxonomy that builds on the nature of the visualized data and the properties of visualization methods. The methods for visualizing approximation sets are analyzed according to a methodology that uses a list of requirements for visualization methods and benchmark approximation sets in a similar way as performance metrics and benchmark test problems are used for comparing optimization algorithms. The methods for visualizing multiobjective problem landscapes are demonstrated on a collection of biobjective problems of increasing difficulty.
The tutorial was held at GECCO 2016, CEC 2017, GECCO 2018, GECCO 2019 and GECCO 2020.
Download tutorial handouts from GECCO 2020 here.