| HOME | HELP | FEEDBACK | SUBSCRIPTIONS | ARCHIVE | SEARCH | TABLE OF CONTENTS |
| ||||||||||||||||||||
|
|
|||||||||||||||||||||||||||||
0 Department of Biology, Eastern Michigan University, Ypsilanti, Michigan 48197 USA; and Biology Department, Schoolcraft College, Livonia, Michigan 48152 USA
Received for publication April 30, 1998. Accepted for publication July 1, 1999.
ABSTRACT
Iris cristata and I. lacustris differ markedly in geographic distribution, glacial history of current ranges, and ecology. We hypothesized that I. cristata, a widespread species of unglaciated regions of eastern North America, would exhibit genetic diversity typical of other widespread plant species, whereas the threatened I. lacustris, which occupies glaciated habitats on Great Lakes shorelines, would display little genetic variation. Iris lacustris lacked detectable polymorphisms in 18 isozyme loci, although we found evidence of possible incomplete gene silencing in four additional loci in some populations. In contrast, I. cristata was polymorphic at 73% of 15 loci examined, with an average of three alleles per locus. Genetic diversity (He) was 0.231. All species-level and population-level estimates of genetic diversity were higher than averages for plants having comparable life history traits. Nearly 98% of the total genetic diversity in I. cristata was apportioned within populations, and heterozygosity and fixation estimates suggest a high level of outcrossing in this species (t = 1.265). The long-lived perennial habit and high outcrossing rate in stable populations are proposed as factors contributing to high genetic diversity in I. cristata. The data are consistent with an hypothesis of a recent origin of I. lacustris from a very limited I. cristata gene pool exacerbated by repeated bottlenecks and founder effects as I. lacustris populations were displaced by lake-level changes over the past 11 000 yr.
Key Words: bottleneck • endemic • founder effect • genetic diversity • glaciation; Iridaceae • Iris • polymorphism
Rare species present opportunities to evolutionary biologists and challenges to conservation biologists. Evolutionary biologists have studied rare species to examine how the levels and patterns of genetic diversity have been influenced by evolutionary history, life history characteristics, and stochastic processes with a goal of understanding the underlying causes of observed genetic diversity. Conservation biologists face the challenge of developing management strategies that promote the long-term survival of rare species, often with little information about the biology or evolutionary history of the species under consideration. Evolutionary and conservation biologists recognize the importance of understanding both the patterns of genetic diversity and the underlying causes of observed genetic diversity (Avise, 1994) when developing plans for the conservation of rare or threatened species (Ellstrand and Elam, 1993
![]() ; Godt and Hamrick, 1993
; Godt and Hamrick, 1993
![]() ).
).
Many rare or endemic species have been found to be genetically depauperate (Gottlieb, 1973
![]() ; Soltis, 1982
; Soltis, 1982
![]() ; Ledig and Conkle, 1983
; Ledig and Conkle, 1983
![]() ; Moran and Hopper, 1983
; Moran and Hopper, 1983
![]() ; Schwartz, 1985
; Schwartz, 1985
![]() ; McClenaghan and Beauchamp, 1986
; McClenaghan and Beauchamp, 1986
![]() ; Waller, O'Malley, and Gawler, 1987
; Waller, O'Malley, and Gawler, 1987
![]() ; Karron et al., 1988
; Karron et al., 1988
![]() ; Lesica et al., 1988
; Lesica et al., 1988
![]() ; Moran, Muona, and Bell, 1989
; Moran, Muona, and Bell, 1989
![]() ; Soltis et al., 1991
; Soltis et al., 1991
![]() ). Explanations of low genetic diversity in rare species have invoked effects of recent evolutionary origin (Ashton and Abbott, 1992
). Explanations of low genetic diversity in rare species have invoked effects of recent evolutionary origin (Ashton and Abbott, 1992
![]() ; Dolan, 1995
; Dolan, 1995
![]() ; Purdy and Bayer, 1995
; Purdy and Bayer, 1995
![]() ), genetic bottlenecks (Kesseli and Jain, 1984
), genetic bottlenecks (Kesseli and Jain, 1984
![]() ; Lesica et al., 1988
; Lesica et al., 1988
![]() ; Waller, O'Malley, and Gawler, 1987
; Waller, O'Malley, and Gawler, 1987
![]() ; Godt, Hamrick, and Bratton, 1995
; Godt, Hamrick, and Bratton, 1995
![]() ) and mating systems that promote inbreeding (Hamrick and Godt, 1989
) and mating systems that promote inbreeding (Hamrick and Godt, 1989
![]() ). Some rare or endemic species have displayed unexpectedly high levels of genetic variation (Gottlieb, 1974
). Some rare or endemic species have displayed unexpectedly high levels of genetic variation (Gottlieb, 1974
![]() ; Griggs and Jain, 1983
; Griggs and Jain, 1983
![]() ; Hiebert and Hamrick, 1983
; Hiebert and Hamrick, 1983
![]() ; Gottlieb, Warwick, and Ford, 1985
; Gottlieb, Warwick, and Ford, 1985
![]() ; Karron et al., 1988
; Karron et al., 1988
![]() ; Nickrent and Wiens, 1989
; Nickrent and Wiens, 1989
![]() ; Godt and Hamrick, 1993
; Godt and Hamrick, 1993
![]() ; Chung, 1994
; Chung, 1994
![]() ; Dolan, 1995
; Dolan, 1995
![]() ; Lewis and Crawford, 1995
; Lewis and Crawford, 1995
![]() ). The history of a population (e.g., recent origin, hybridization, occurrence of bottlenecks, or range expansion following climatic change) may significantly affect levels and patterns of genetic diversity and may lead to conflicting patterns in different species (Hiebert and Hamrick, 1983
). The history of a population (e.g., recent origin, hybridization, occurrence of bottlenecks, or range expansion following climatic change) may significantly affect levels and patterns of genetic diversity and may lead to conflicting patterns in different species (Hiebert and Hamrick, 1983
![]() ; Ledig and Conkle, 1983
; Ledig and Conkle, 1983
![]() ; Schnabel, Hamrick, and Wells, 1993
; Schnabel, Hamrick, and Wells, 1993
![]() ; Lewis and Crawford, 1995
; Lewis and Crawford, 1995
![]() ; Godt and Hamrick, 1996
; Godt and Hamrick, 1996
![]() ). For example, the effects of recent glacial events have been invoked as explanations for low genetic diversity (because of genetic bottleneck effects) (Loveless and Hamrick, 1988
). For example, the effects of recent glacial events have been invoked as explanations for low genetic diversity (because of genetic bottleneck effects) (Loveless and Hamrick, 1988
![]() ) or for higher than expected genetic diversity, possibly because of long-term stability of populations occupying refugia (Lewis and Crawford, 1995
) or for higher than expected genetic diversity, possibly because of long-term stability of populations occupying refugia (Lewis and Crawford, 1995
![]() ). Clearly, factors such as bottlenecks, range expansion from refugia, reproductive biology, and population size have the potential to influence levels and patterns of genetic diversity. The purpose of this paper is to report on genetic variation in a threatened species and its widespread, closely related congener having similar reproductive characteristics but very different geographic distributions with different glacial histories.
). Clearly, factors such as bottlenecks, range expansion from refugia, reproductive biology, and population size have the potential to influence levels and patterns of genetic diversity. The purpose of this paper is to report on genetic variation in a threatened species and its widespread, closely related congener having similar reproductive characteristics but very different geographic distributions with different glacial histories.
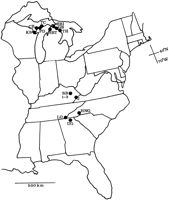
Iris lacustris Nutt., dwarf lake iris, is a federally threatened herbaceous perennial plant species endemic to the Great Lakes region (Harrison, 1988
![]() ). It grows primarily on calcareous substrates, most often near the margins of northern white cedar (Thuja occidentalis L.) forests along the glaciated shores of lakes Michigan and Huron (Fig. 1). Populations of I. lacustris in Wisconsin are genetically uniform, as determined by isozyme electrophoresis (Simonich and Morgan, 1994
). It grows primarily on calcareous substrates, most often near the margins of northern white cedar (Thuja occidentalis L.) forests along the glaciated shores of lakes Michigan and Huron (Fig. 1). Populations of I. lacustris in Wisconsin are genetically uniform, as determined by isozyme electrophoresis (Simonich and Morgan, 1994
![]() ). The reproductive biology of I. lacustris is poorly known. Only a small proportion of shoots flower in a population, particularly when light intensity and soil moisture are low (Planisek, 1983
). The reproductive biology of I. lacustris is poorly known. Only a small proportion of shoots flower in a population, particularly when light intensity and soil moisture are low (Planisek, 1983
![]() ; Van Kley and Wujek, 1993
; Van Kley and Wujek, 1993
![]() ). Plants are self-compatible, but natural fruit set and seed set are low (Hannan, unpublished data). Iris cristata Aiton, dwarf crested iris, is the only other crested iris in eastern North America and, as such, is presumed to be the nearest relative of the morphologically very similar I. lacustris. Iris cristata is widespread throughout unglaciated eastern North America from central Ohio to Georgia and Oklahoma, primarily in the Appalachian region (Gleason and Cronquist, 1991
). Plants are self-compatible, but natural fruit set and seed set are low (Hannan, unpublished data). Iris cristata Aiton, dwarf crested iris, is the only other crested iris in eastern North America and, as such, is presumed to be the nearest relative of the morphologically very similar I. lacustris. Iris cristata is widespread throughout unglaciated eastern North America from central Ohio to Georgia and Oklahoma, primarily in the Appalachian region (Gleason and Cronquist, 1991
![]() ). Iris cristata also has been shown to be self-compatible, although natural fruit set and seed set are low (Motten, 1986
). Iris cristata also has been shown to be self-compatible, although natural fruit set and seed set are low (Motten, 1986
![]() ). Both species are apparently polyploid, each species having a somatic chromosome number of 32 (Foster, 1937
). Both species are apparently polyploid, each species having a somatic chromosome number of 32 (Foster, 1937
![]() ; Pringle, 1976
; Pringle, 1976
![]() ). This pair of morphologically similar species provides an excellent opportunity to study some of the relationships linking evolutionary history, glacial history, reproductive biology, and genetic diversity in geographically and ecologically restricted vs. widespread plant species. We hypothesize that the threatened species occupying glaciated habitats will be genetically depauperate, possibly because of its recent evolutionary origin and founder effects resulting from repeated population extinction and recolonization events.
). This pair of morphologically similar species provides an excellent opportunity to study some of the relationships linking evolutionary history, glacial history, reproductive biology, and genetic diversity in geographically and ecologically restricted vs. widespread plant species. We hypothesize that the threatened species occupying glaciated habitats will be genetically depauperate, possibly because of its recent evolutionary origin and founder effects resulting from repeated population extinction and recolonization events.
|
Seven populations of Iris cristata and nine populations of I. lacustris were sampled (Fig. 1; Table 1). Two leaves from each of 30 widely spaced shoots were collected from seven I. cristata populations. Two I. cristata populations (J and SB1) were very small, yielding only 14 and three samples, respectively. Twenty-five widely spaced shoots were collected from each population of I. lacustris. All samples were placed on ice until isozymes were extracted, not more than 7 d after collecting. Approximately 200–800 mg of leaf tissue were ground with a cold mortar and pestle to which ~500 mg sand and ~200–800 µL of extraction buffer (0.10 mol/L Tris-HCl, pH 7.5; 0.1% (v/v) 2-mercaptoethanol; 4% PVP[ polyvinyl pyrolidone] 40000) had been added. Extracts were absorbed onto filter paper chromatography wicks and stored at -70�C until electrophoresed.
|
|
![]()
Wright's fixation index (F) (Wright, 1922
![]() ) was calculated using polymorphic loci according to the formula:
) was calculated using polymorphic loci according to the formula:
![]()
 2 analysis (Li and Horvitz, 1953
![]()
2 analyses were used to test for significant differences in allele frequencies among populations for each polymorphic locus (Workman and Niswander, 1970
![]()
![]()
![]()
RESULTS
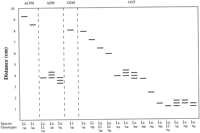
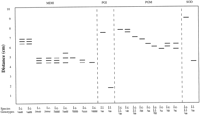
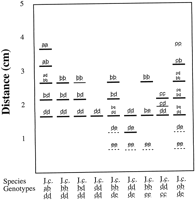
Interpretation of isozyme bands in Iris cristata
For each isozyme, bands were assigned to putative loci (Table 2) from analysis of observed variation patterns and quaternary structure reported in other plants (Figs. 2–5![]()
![]()
![]() ). Segregation analyses were not available because seeds of Iris cristata and I. lacustris germinate sporadically only after long periods of dormancy. Single, invariant banding patterns were interpreted as products of single, homozygous loci. Multiple band patterns were interpreted as results of disomic inheritance unless such patterns were interpretable in a more direct manner (i.e., not requiring null alleles or inactive homo- or heterodimers) by assuming tetrasomic inheritance. Two alleles of GOT 5 were interpreted as forming null homodimers, yielding only two visible bands in heterozygous individuals carrying either allele d or e. MDH and 6-PGD exhibited variation patterns consistent with tetrasomic inheritance (i.e., one to several bands of differing intensities; Figs. 3–4).
). Segregation analyses were not available because seeds of Iris cristata and I. lacustris germinate sporadically only after long periods of dormancy. Single, invariant banding patterns were interpreted as products of single, homozygous loci. Multiple band patterns were interpreted as results of disomic inheritance unless such patterns were interpretable in a more direct manner (i.e., not requiring null alleles or inactive homo- or heterodimers) by assuming tetrasomic inheritance. Two alleles of GOT 5 were interpreted as forming null homodimers, yielding only two visible bands in heterozygous individuals carrying either allele d or e. MDH and 6-PGD exhibited variation patterns consistent with tetrasomic inheritance (i.e., one to several bands of differing intensities; Figs. 3–4).
|
|
|
|
GOT was interpreted to be the product of four loci in Iris lacustris, corresponding to GOT-1,-2,-3 and -5 of I. cristata (Fig. 2). GOT-2 and GOT-3 appeared as monomorphic, homozygous loci. GOT-1 produced a single-banded phenotype in all populations except GB and in two plants from THI that exhibited a band intermediate between GOT-1 and GOT-2. The lack of homozygous-fast and homozygous-slow phenotypes in either population was interpreted as evidence that the three-banded phenotype was not the result of heterozygosity at one locus. The intermediate band was interpreted as representing an interlocus heterodimer with the product of an additional gene expressed in all GB individuals and in most individuals in THI (Table 3). That additional locus, being expressed in only two populations, was excluded from analyses. GOT-5 was considered to be homologous with GOT-5 in I. cristata and, in most I. lacustris populations, produced a single-banded phenotype expected of a homozygote (Fig. 2). All plants from CB and TC exhibited a three-banded phenotype expected of a heterozygous genotype (i.e., GOT-5 ac), as is commonly found in I. cristata. Rather than interpret the three-banded pattern as a fixed heterozygote in those populations, however, we interpreted the three-banded pattern as a result of an additional active gene producing a product that formed an interlocus heterodimer with the protein product of locus GOT-5. That additional locus was excluded from analyses.
|
PGI was assumed to be controlled by two genes. Pgi-1 was monomorphic and homozygous in all populations of I. lacustris. Pgi-2 produced both one-banded and three-banded phenotypes. Two alternative interpretations of this locus were consistent with the occurrence of three bands in some plants from five populations (CB, KS, PD, SBT, and TC) and a single band in the other four populations. If the three-banded pattern is interpreted as the product of one locus existing as two alleles (a,b), then three genotypes (aa, ab, bb) would be expected in polymorphic populations. However, genotype aa was not found in any population, not even in PD, where 21 of 25 plants sampled exhibited the three-banded phenotype. The lack of any aa genotypes casts doubt on this interpretation of the Pgi-2 locus, unless the aa homodimer is present but inactive. An alternative explanation is that Pgi-2 exists in all plants as a homozygous locus (genotype aa) and some plants in each of five populations (CB, KS, PD, SBT, and TC; Table 3) expressed an additional homozygous locus, the product of which forms an interlocus heterodimer with the product of PGI-2. The lack of this additional gene product may be due to gene silencing, a phenomenon known to occur in polyploid species (Ferris, Portnoy, and Whitt, 1979
![]() ; Wilson, Barber, and Walters, 1983
; Wilson, Barber, and Walters, 1983
![]() ; Weeden and Wendel, 1989
; Weeden and Wendel, 1989
![]() ). We used the second interpretation in this study (Fig. 3). The high chromosome number (2n = 32) suggests that both I. cristata and I. lacustris are polyploid.
). We used the second interpretation in this study (Fig. 3). The high chromosome number (2n = 32) suggests that both I. cristata and I. lacustris are polyploid.
SOD produced two banding zones. The faster zone, in all populations except BBI, contained a single band, as expected in a homozygote. In BBI, however, a three-banded phenotype occurred in all individuals (Table 3). Because the entire sample showed this phenotype, it was interpreted as the result of an additional homozygous locus being expressed, yielding an intermediate interlocus heterodimer. This locus was silenced in all other populations and was excluded from analyses. A second scored SOD locus produced an invariant homozygous phenotype (Fig. 3).
TPI produced an invariant five-banded phenotype similar to that observed in some I. cristata individuals (Fig. 5). That pattern was interpreted as being the result of three homozygous genes, with formation of interlocus heterodimers (Fig. 5). If only two genes were assumed, then all individuals would have to be scored as heterozygous for the Tpi-2 locus, an unlikely situation in a species that reproduces sexually. That unlikely interpretation is rejected in favor of the three-locus model. F values based on the two Tpi loci in I. cristata (F =-0.219 for Tpi-1; F = -0.281 for Tpi-2) were similar to those calculated for Adh, Mdh-1, and Pgm-1 (F = -0.300, -0.260, and -0.286, respectively), suggesting that the three-locus interpretation based on variation found in I. cristata is plausible.
Results of isozyme analyses
Iris cristata and I. lacustris differed strikingly in levels of genetic diversity. Iris cristata was highly variable by all measures of genetic diversity, both at the population level and at the species level. Iris lacustris, however, exhibited no polymorphic loci, according to our interpretation of banding patterns.
At the population level, Iris cristata was highly variable (P = 0.514; A = 1.867; Ae = 1.398; He = 0.199). These values are higher than those reported in Hamrick and Godt (1989)
![]() for widespread species (P = 0.430; A = 1.72; Ae = 1.23; He = 0.159) and long-lived herbaceous perennials, although the latter category is based on only four species (P = 0.393; A = 1.44; Ae = 1.14; He = 0.084). Estimates of genetic diversity (He) of I. cristata populations varied from 0.111 to 0.230, with the smallest populations (J and SB1) having the lowest diversity (Table 4). Mean outcrossing rate (t) was estimated to be 1.265. Significant differences in allele frequencies among populations of Iris cristata were found in four of the eight disomic loci examined (Table 5).
for widespread species (P = 0.430; A = 1.72; Ae = 1.23; He = 0.159) and long-lived herbaceous perennials, although the latter category is based on only four species (P = 0.393; A = 1.44; Ae = 1.14; He = 0.084). Estimates of genetic diversity (He) of I. cristata populations varied from 0.111 to 0.230, with the smallest populations (J and SB1) having the lowest diversity (Table 4). Mean outcrossing rate (t) was estimated to be 1.265. Significant differences in allele frequencies among populations of Iris cristata were found in four of the eight disomic loci examined (Table 5).
|
|
![]()
2 tests (Li and Horvitz, 1953
At the species level, Iris cristata exhibited more genetic variation as measured by proportion of polymorphic loci (Ps = 0.733), number of alleles per locus (As = 3.000) or per polymorphic locus (Aps = 3.727), number of effective alleles (Aes = 1.300), and genetic diversity (Hes = 0.231) than did I. lacustris, which exhibited no polymorphisms at any loci studied (Table 6). Iris cristata was more variable than species with wide geographic ranges (Ps = 0.589; As = 2.29; Aes = 1.31; Hes = 0.202) and long-lived herbaceous perennials (Ps = 0.396; As = 1.42; Aes = 1.28; Hes = 0.205), as summarized by Hamrick and Godt (1989)
![]() , although the average number of effective alleles for widespread species and herbaceous perennials were very similar to that found in I. cristata.
, although the average number of effective alleles for widespread species and herbaceous perennials were very similar to that found in I. cristata.
|
Iris cristata and I. lacustris exhibit strikingly different patterns of isozyme variation. The endemic I. lacustris displayed no polymorphic loci, according to our interpretation of banding patterns, whereas I. cristata was extremely variable at both the population and species level as compared to other plant species. This discussion will focus on the causes of high diversity in I. cristata and on the evolutionary and geological processes responsible for the lack of polymorphic loci in I. lacustris.
Iris cristata populations exhibited higher values of P, A, Ae, and He than did comparable categories of plants summarized in Hamrick and Godt (1989),
![]() which included widespread species, outcrossing species, long-lived perennial species, and species employing a combination of sexual and asexual reproduction. Widespread species and animal-mediated outcrossing species categories exhibited the highest average genetic diversity (He). The wide geographic range in a variety of forest types, perennial habit, and entomophilous pollination (Motten, 1986
which included widespread species, outcrossing species, long-lived perennial species, and species employing a combination of sexual and asexual reproduction. Widespread species and animal-mediated outcrossing species categories exhibited the highest average genetic diversity (He). The wide geographic range in a variety of forest types, perennial habit, and entomophilous pollination (Motten, 1986
![]() ) of I. cristata led us to hypothesize that this species would exhibit high levels of genetic variation. The extent of self-pollination and self-fertilization in I. cristata is not known, but the outcrossing estimates reported in this paper (t = 1.265) suggests a mixed-mating system in I. cristata, a situation that would be expected to enhance opportunities for maintaining genetic diversity within populations. Being a clonally reproducing species, the importance of seed production is unknown, but the maintenance of high genetic diversity, once produced, within populations of I. cristata might be promoted by its clonal habit. Other workers have proposed that asexual reproduction may promote the maintenance of unexpectedly high genetic diversity in, for example, Populus tremuloides (Cheliak and Dancik, 1982
) of I. cristata led us to hypothesize that this species would exhibit high levels of genetic variation. The extent of self-pollination and self-fertilization in I. cristata is not known, but the outcrossing estimates reported in this paper (t = 1.265) suggests a mixed-mating system in I. cristata, a situation that would be expected to enhance opportunities for maintaining genetic diversity within populations. Being a clonally reproducing species, the importance of seed production is unknown, but the maintenance of high genetic diversity, once produced, within populations of I. cristata might be promoted by its clonal habit. Other workers have proposed that asexual reproduction may promote the maintenance of unexpectedly high genetic diversity in, for example, Populus tremuloides (Cheliak and Dancik, 1982
![]() ; Mitton and Grant, 1996
; Mitton and Grant, 1996
![]() ), Fagus grandifolia (Houston and Houston, 1994
), Fagus grandifolia (Houston and Houston, 1994
![]() ), and Gleditsia triacanthos (Schnabel and Hamrick, 1990
), and Gleditsia triacanthos (Schnabel and Hamrick, 1990
![]() ).
).
Population size appears to be associated with differences in genetic diversity within Iris cristata. Comparisons of expected (under Hardy-Weinberg equilibrium) vs. observed heterozygosity in Iris cristata showed the three large populations (LO, UG, SB3) to have deficits of heterozygotes, whereas the four small to very small populations (HNG, J, SB1, SB2) had surpluses of heterozygotes (Table 4). This is consistent with the finding that LO and SB3 had more positive than negative significant deviations in fixation indices from zero, whereas the remaining populations all had equal numbers of positive and negative deviations (SB1, the smallest population, had no significant deviations). The small populations may comprise few clones with little sexual reproduction occurring, producing genotypic frequencies that might correspond to those of the founder populations rather than to sexually maintained equilibrium frequencies. Iris cristata population J stood out as a genetically depauperate population (Table 4). That population was a very small and dense cluster of shoots occupying an area of ~3 x 3 m and might have consisted of very few genets (population J exhibited only two multilocus genotypes). Deficits of heterozygotes in large populations might result from more abundant sexual reproduction involving selfing or biparental inbreeding. Although I. cristata is self-compatible, neither selfing rates nor recruitment from seed have been measured directly.
Four of the eight polymorphic disomic loci observed in Iris cristata exhibited significant differences in allele frequency among populations (Table 5). In spite of those allele frequency differences, only 1.79% of the diversity observed in the seven populations studied was apportioned among populations (Table 5). This FST value is low relative to average comparable GST values reported in Hamrick and Godt (1989)
![]() . However, FST calculations excluded 6-Pgd and both Mdh loci; 6-Pgd and Mdh were among the more diverse loci of those studied, as measured by number of loci present (Table 2). Therefore, the estimated genetic diversity reported here is likely to be an underestimate, and the effect of including the tetrasomic loci on FST is not known. High estimated gene flow (Nm = 13.72) should promote the integration of populations into a more panmictic unit that would emphasize within- as opposed to among-population differentiation. Neither pollen flow nor seed dispersal have been measured in I. cristata, but our data suggest that gene flow between populations is high. This high estimate of gene flow also might be an overestimate for the species as a whole because three of the sampled populations (SB1, SB2, SB3) were within ~2 km of each other.
. However, FST calculations excluded 6-Pgd and both Mdh loci; 6-Pgd and Mdh were among the more diverse loci of those studied, as measured by number of loci present (Table 2). Therefore, the estimated genetic diversity reported here is likely to be an underestimate, and the effect of including the tetrasomic loci on FST is not known. High estimated gene flow (Nm = 13.72) should promote the integration of populations into a more panmictic unit that would emphasize within- as opposed to among-population differentiation. Neither pollen flow nor seed dispersal have been measured in I. cristata, but our data suggest that gene flow between populations is high. This high estimate of gene flow also might be an overestimate for the species as a whole because three of the sampled populations (SB1, SB2, SB3) were within ~2 km of each other.
Long-term stability of Iris cristata populations, coupled with the perennial, clonal habit of this species, might help explain the observed high within-population genetic diversity. Iris cristata inhabits stable forest habitats that occur south of the Wisconsinan glacial maximum. In the absence of drastic reductions in population size that produce genetic bottlenecks and without repeated episodes of local population extinction and recolonization, high genetic diversity within populations could be maintained. Other authors have linked high genetic diversity, even in endemic species, to a clonal, long-lived perennial growth habit and large population size (Standley, Dudley, and Bruederle, 1991
![]() ).
).
In contrast to the wide geographic range and apparent ecological amplitude exhibited by Iris cristata, I. lacustris occurs mostly in shoreline habitats of Lakes Michigan and Huron (Van Kley and Wujek, 1993
![]() ) in a glaciated region that has remained ice-free for only ~11 000 yr (Karrow, 1987
) in a glaciated region that has remained ice-free for only ~11 000 yr (Karrow, 1987
![]() ). In addition, fluctuations in Great Lakes water levels during this time period have exceeded 80 m (Colman et al., 1994
). In addition, fluctuations in Great Lakes water levels during this time period have exceeded 80 m (Colman et al., 1994
![]() ). Northern Lake Michigan experienced higher lake levels between 7300 and 5900 yr before present (Karrow, 1987
). Northern Lake Michigan experienced higher lake levels between 7300 and 5900 yr before present (Karrow, 1987
![]() ), and, at various times during the past 6000 yr, Lake Michigan levels were higher than today by as much as 5.5 m (Dott and Mickelson, 1995
), and, at various times during the past 6000 yr, Lake Michigan levels were higher than today by as much as 5.5 m (Dott and Mickelson, 1995
![]() ). Therefore, populations of I. lacustris on current lakeshore sites cannot be older than 11 000 yr and they are likely to be much younger because current lakeshore populations occupy sites that were inundated in the recent past. Founder effects, such as those associated with repeated population extinction and recolonization, would be expected to produce genetically distinct but depauperate populations if genetic diversity existed in populations initially, as has been hypothesized for small populations of Carex polymorpha (Standley, Dudley, and Bruederle, 1991
). Therefore, populations of I. lacustris on current lakeshore sites cannot be older than 11 000 yr and they are likely to be much younger because current lakeshore populations occupy sites that were inundated in the recent past. Founder effects, such as those associated with repeated population extinction and recolonization, would be expected to produce genetically distinct but depauperate populations if genetic diversity existed in populations initially, as has been hypothesized for small populations of Carex polymorpha (Standley, Dudley, and Bruederle, 1991
![]() ), Astragalus cremnophylax var. cremnophylax (Travis, Maschinski, and Keim, 1996
), Astragalus cremnophylax var. cremnophylax (Travis, Maschinski, and Keim, 1996
![]() ), Fagus crenata (Tomaru et al., 1997
), Fagus crenata (Tomaru et al., 1997
![]() ), Erythronium montanum (Allen et al., 1996
), Erythronium montanum (Allen et al., 1996
![]() ; Broyles, 1998
; Broyles, 1998
![]() ), and Pseudorchis albida (Reinhammer and Hedren, 1998
), and Pseudorchis albida (Reinhammer and Hedren, 1998
![]() ). In I. lacustris, the interpopulation differentiation expected of populations subjected to bottlenecks and founder effects was not detected because the species as a whole is genetically depauperate. The hypothesis of a recent evolutionary origin from a single founding population that contained no genetic variation is consistent with our observations. It is important to note, however, that genetic variation was detected in a few populations, but only in the form of differential gene silencing, as has been hypothesized in polyploid Yucca (Massey and Hamrick, 1998
). In I. lacustris, the interpopulation differentiation expected of populations subjected to bottlenecks and founder effects was not detected because the species as a whole is genetically depauperate. The hypothesis of a recent evolutionary origin from a single founding population that contained no genetic variation is consistent with our observations. It is important to note, however, that genetic variation was detected in a few populations, but only in the form of differential gene silencing, as has been hypothesized in polyploid Yucca (Massey and Hamrick, 1998
![]() ). Four genes were expressed in individuals in some populations but not in others (Table 3). Although such variation may be genetically important, it did not contribute to any of the standard measures of genetic diversity or its partitioning.
). Four genes were expressed in individuals in some populations but not in others (Table 3). Although such variation may be genetically important, it did not contribute to any of the standard measures of genetic diversity or its partitioning.
In conclusion, the glacial history of the habitat of Iris lacustris, the total lack of detectable isozyme variation at any locus, and the observation that nearly all isozymes found in I. lacustris exhibited identical electrophoretic mobilities to those of I. cristata lead us to accept our hypothesis of a geologically recent origin of I. lacustris from a single, genetically depauperate I. cristata gene pool. A genetically uniform founding population, even with repeated subsequent population extinctions and colonizations, would produce genetic uniformity among extant populations. Only after accumulation of detectable mutations might founder effects and genetic drift generate significant interpopulation differentiation. The present geographic range of I. cristata, in contrast, lies south of the Wisconsinan glacial maximum. Consequently, I. cristata has potentially occupied habitats, and sites, that have been similar to those found today for a very long time. The relative stability afforded I. cristata over a long time span might have allowed the accumulation and maintenance of significant genetic variation in the form of multiple alleles per locus. Without genetic bottlenecks during periods of range contractions and without repeated population extinctions and recolonizations, I. cristata populations could maintain their accumulated genetic diversity over long periods of time.
FOOTNOTES
1 The authors thank Dr. Leo Bruederle for assistance with electrophoresis methods, Ms. Shakunthala Jayaram Mitta for laboratory work, Annie Hannan for field work, the Michigan Chapter of The Nature Conservancy, the Michigan Department of Natural Resources Nongame Wildlife Fund-Natural Heritage Small Grants Program, the Eastern Michigan University Graduate School, and the Biology Department of Eastern Michigan University for financial support, and The University of Michigan Biological Station for use of its facilities. ![]()
LITERATURE CITED
Allen, G. A., J. A. Antos, A. C. Worley, T. A. Suttill, and R. J. Hebda. 1996 Morphological and genetic variation in disjunct populations of the avalanche lily Erythronium montanum. Canadian Journal of Botany 74: 403–412.
Ashton, P. A., and R. J. Abbott. 1992 Multiple origins and genetic diversity in the newly arisen allopolyploid species, Senecio cambrensis Rosser (Compositae). Heredity 68: 25–32. [ISI]
Avise, J. C. 1994 Molecular markers, natural history and evolution. Chapman and Hall, New York, New York, USA.
Broyles, S. B. 1998 Postglacial migration and the loss of allozyme variation in northern populations of Asclepias exaltata (Asclepiadaceae). American Journal of Botany 85: 1091–1097. [Abstract]
Cheliak, W. M., and B. P. Dancik. 1982 Genetic diversity of natural populations of a clone-forming tree Populus tremuloides. Canadian Journal of Genetics and Cytology 24: 611–616.
Chung, M. G. 1994 Genetic variation and population structure in Korean endemic species. 3. Hosta minor (Liliaceae). Journal of Plant Research 107: 377–383. [ISI]
Colman, S. M., R. M. Forester, R. L. Reynolds, D. S. Sweetkind, J. W. King, P. Gangemi, G. A. Jones, L. D. Keigwin, and D. S. Foster. 1994 Lake-level history of Lake Michigan for the past 12,000 years: the record from deep lacustrine sediments. Journal of Great Lakes Research 20: 73–92. [ISI]
Dolan, R. W. 1995 The rare, serpentine endemic Streptanthus morrisonii (Brassicaceae) species complex, revisited using isozyme analysis. Systematic Botany 20: 338–346. [ISI]
Dott, E. R., and D. Mickelson. 1995 Lake Michigan water levels and the development of Holocene beach-ridge complexes at Two Rivers, Wisconsin: stratigraphic, geomorphic, and radiocarbon evidence. Geological Society of America Bulletin 107: 286–296. [ISI]
Ducousso, A., D. Petit, M. Valero, and P. Vernet. 1990 Genetic variation between and within populations of a perennial grass: Arrhenatherum elatius. Heredity 65: 179–188.
Ellstrand, N. C., and D. R. Elam. 1993 Population genetic consequences of small population size: implications for plant conservation. Annual Review of Ecology and Systematics 24: 217–242. [ISI]
Ferris, S. D., S. L. Portnoy, and G. S. Whitt. 1979 The roles of speciation and divergence time in the loss of duplicate gene expression. Theoretical Population Biology 15: 114–139. [ISI]
Foster, R. C. 1937 A cyto-taxonomic survey of the North American species of Iris. Contributions of the Gray Herbarium 119: 1–82.
Gleason, H. A., and A. Cronquist. 1991 Manual of vascular plants of northeastern United States and adjacent Canada. New York Botanical Garden, Bronx, New York, USA.
Godt, M. J. W., and J. L. Hamrick. 1993 Genetic diversity and population structure in Tradescantia hirsuticaulis (Commelinaceae). American Journal of Botany 80: 959–966. [ISI]
———, and ———. 1996 Genetic diversity and morphological differentiation in Liatris helleri (Asteraceae), a threatened plant species. Biodiversity and Conservation 5: 461–471. [ISI]
———, ———, and S. Bratton. 1995 Genetic diversity in a threatened wetland species, Helonias bullata (Liliaceae). Conservation Biology 9: 596–604. [ISI]
Gottlieb, L. D. 1973 Enzyme differentiation and phylogeny in Clarkia franciscana, Clarkia rubicunda, and Clarkia amoena. Evolution 27: 205–214.
———. 1974 Genetic confirmation of the origin of Clarkia lingulata. Evolution 28: 244–250.
———, S. I. Warwick, and V. S. Ford. 1985 Morphological and electrophoretic divergence between Layia discoidea and L. glandulosa. Systematic Botany 10: 484–495.
Griggs, F. T., and S. K. Jain. 1983 Conservation of vernal pool plants in California. II. Population biology of a rare and unique grass genus Orcuttia. Biological Conservation 27: 171–193.
Hamrick, J. L., and M. J. W. Godt. 1989 Allozyme diversity in plant species. In A. H. D. Brown, M. T. Clegg, A. L. Kahler, and B. S. Weir [eds.], Plant population genetics, breeding and genetic resources, 43–63. Sinauer, Sunderland, Massachusetts, USA.
Harrison, W. F. 1988 Endangered and threatened wildlife and plants: determination of threatened status for Iris lacustris (Dwarf Lake Iris). Federal Register 53: 37972–37975.
Hedrick, P. W. 1983 Genetics of populations. Science Books International, Boston, Massachusetts, USA.
Hiebert, R. D., and J. L. Hamrick. 1983 Patterns and levels of genetic variation in Great Basin bristlecone pine, Pinus longaeva. Evolution 37: 302–310.
Houston, D. B., and D. R. Houston. 1994 Variation in American beech (Fagus grandifolia Ehrh.): isozyme analysis of genetic structure in selected stands. Silvae Genetica 43: 277–284. [ISI]
Karron, J. D., Y. B. Linhart, C. A. Chaulk, and C. A. Robertson. 1988 Genetic structure of populations of geographically restricted and widespread species of Astragalus (Fabaceae). American Journal of Botany 75: 1114–1119. [ISI]
Karrow, P. F. 1987 Glacial and glaciolacustrine events in northwestern Lake Huron, Michigan and Ontario. Geological Society of America Bulletin 98: 113–120. [ISI]
Kesseli, R. V., and S. K. Jain. 1984 New variation and biosystematic patterns detected by allozyme and morphological comparisons in Limnanthes sect. Reflexae (Limnanthaceae). Plant Systematics and Evolution 147: 133–165. [ISI]
Ledig, D. A., and M. T. Conkle. 1983 Gene diversity and genetic structure in a narrow endemic, Torrey Pine (Pinus torreyana Parry ex Carr.). Evolution 37: 79–85. [ISI]
Lesica, P., R. F. Leary, F. W. Allendorf, and D. E. Bilderback. 1988 Lack of genic diversity within and among populations of an endangered plant, Howellia aquatilis. Conservation Biology 2: 275–282.
Lewis, P. O., and D. J. Crawford. 1995 Pleistocene refugium endemics exhibit greater allozymic diversity than widespread congeners in the genus Polygonella (Polygonaceae). American Journal of Botany 82: 141–149. [ISI]
———, and R. Whitkus. 1989 GENESTAT for microcomputers. American Society of Plant Taxonomists Newsletter 2: 15–16.
Li, C. C., and D. G. Horvitz. 1953 Some methods of estimating the inbreeding coefficient. American Journal of Human Genetics 5: 107–117. [ISI]
Loveless, M. D., and J. L. Hamrick. 1988 Genetic organization and evolutionary history in two North American species of Cirsium. Evolution 42: 254–265.
Massey, L. K., and J. L. Hamrick. 1998 Genetic diversity and population structure of Yucca filamentosa (Agavaceae). American Journal of Botany 85: 340–345. [Abstract]
McClenaghan, L. R. J., and A. C. Beauchamp. 1986 Low genic differentiation among isolated populations of the California fan palm (Washingtonia filifera). Evolution 40: 315–322. [ISI]
Mitton, J. B., and M. C. Grant. 1996 Genetic variation and the natural history of quaking aspen. BioScience 46: 25–31. [ISI]
Moran, G. F., and S. D. Hopper. 1983 Genetic diversity and the insular population structure of Eucalyptus caesia Benth. Australian Journal of Botany 31: 161–172. [ISI]
———, O. Muona, and J. C. Bell. 1989 Acacia mangiana: a tropical forest tree of the coastal lowlands with low genetic diversity. Evolution 43: 231–235. [ISI]
Motten, A. F. 1986 Pollination ecology of the spring wildflower community of a temperate deciduous forest. Ecological Monographs 56: 21–42. [ISI]
Nickrent, D. L., and D. Wiens. 1989 Genetic diversity in the rare California shrub Dedeckera eurekensis (Polygonaceae). Systematic Botany 14: 245–253. [ISI]
Planisek, S. L. 1983 The breeding system, fecundity, and dispersal of Iris lacustris. Michigan Botanist 22: 93–102.
Pringle, J. S. 1976 Annotated chromosome counts for some plants of the dunes and pannes along the shores of the upper Great Lakes. Michigan Botanist 15: 157–163.
Purdy, B. G., and R. J. Bayer. 1995 Allozyme variation in the Athabasca sand dune endemic, Salix silicicola, and the closely related widespread species, S. alaxensis. Systematic Botany 20: 179–190.
Reinhammer, L. G., and M. Hedren. 1998 Allozyme differentiation between lowland and alpine populations of Pseudorchis albida s. lat. (Orchidaceae) in Sweden. Nordic Journal of Botany 18: 7–14. [ISI]
Schnabel, A., and J. L. Hamrick. 1990 Organization of genetic diversity within and among populations of Gleditsia triacanthos (Leguminosae). American Journal of Botany 77: 1060–1069. [ISI]
———, ———, and P. V. Wells. 1993 Influence of Quaternary history on the population genetic structure of Douglas-Fir (Pseudo-tsuga menziesii) in the Great Basin. Canadian Journal of Forest Research 23: 1900–1906. [ISI]
Schwartz, O. A. 1985 Lack of protein polymorphism in the endemic relict Chrysosplenium iowense (Saxifragaceae). Canadian Journal of Botany 63: 2031–2034. [ISI]
Simonich, M. T., and M. D. Morgan. 1994 Allozymic uniformity in Iris lacustris (dwarf lake iris) in Wisconsin. Canadian Journal of Botany 72: 1720–1722. [ISI]
Soltis, D. E. 1982 Allozymic variability in Sullivantia (Saxifragaceae). Systematic Botany 7: 26–34. [ISI]
Soltis, D. E., C. H. Haufler, D. C. Darrow, and G. J. Gastony. 1983 Starch gel electrophoresis of ferns: a compilation of grinding buffers, gel and electrode buffers, and staining schedules. American Fern Journal 63: 9–27.
Soltis, P. S., D. E. Soltis, T. L. Tucker, and F. A. Lang. 1991 Allozyme variability is absent in the narrow endemic Bensoniella oregana (Saxifragaceae). Conservation Biology 6: 131–134. [ISI]
Standley, L. A., J. L. Dudley, and L. P. Bruederle. 1991 Electrophoretic variability in the rare sedge, Carex polymorpha (Cyperaceae). Bulletin of the Torrey Botanical Club 11: 444–450.
Tomaru, N., T. Mitsutsuji, M. Takahashi, Y. Tsumura, K. Uchida, and K. Ohba. 1997 Genetic diversity in Fagus crenata (Japanese beech): influence of the distributional shift during the late-Quaternary. Heredity 78: 241–251. [ISI]
Travis, S. E., J. Maschinski, and P. Keim. 1996 An analysis of genetic variation in Astragalus cremnophylax var. cremnophylax, a critically endangered plant, using AFLP markers. Molecular Ecology 5: 735–745. [ISI][Medline]
Van Kley, J. E., and D. E. Wujek. 1993 Habitat and ecology of Iris lacustris (the dwarf lake iris). Michigan Botanist 32: 209–222.
Waller, D. M., D. M. O'Malley, and S. C. Gawler. 1987 Genetic variation in the extreme endemic Pedicularis furbishiae (Scrophulariaceae). Conservation Biology 1: 335–340.
Weeden, N. F., and J. F. Wendel. 1989 Genetics of Plant Isozymes. In D. E. Soltis and P. S. Soltis [eds.], Isozymes in plant biology, 46–72. Dioscorides Press, Portland, Oregon, USA.
Weir, B. S., and C. C. Cockerham. 1984 Estimating F-statistics for the analysis of population structure. Evolution 38: 1358–1370. [ISI]
Wilson, H. D., S. C. Barber, and T. Walters. 1983 Loss of duplicate gene expression in tetraploid Chenopodium. Biochemical Systematics and Ecology 11: 7–13.
Workman, P. L., and J. D. Niswander. 1970 Population studies on southwestern Indian tribes. II. Local genetic differentiation in the Papago. American Journal of Human Genetics 22: 24–49. [ISI][Medline]
Wright, S. 1922 Coefficients of inbreeding and relationship. American Naturalist 56: 330–338.
———. 1951 The genetical structure of populations. Annals of Eugenics 15: 323–354. [ISI]
This article has been cited by other articles:
 |
J. GONZALEZ-ASTORGA, A. P. VOVIDES, A. CRUZ-ANGON, P. OCTAVIO-AGUILAR, and C. IGLESIAS Allozyme Variation in the Three Extant Populations of the Narrowly Endemic Cycad Dioon angustifolium Miq. (Zamiaceae) from North-eastern Mexico Ann. Bot., May 1, 2005; 95(6): 999 - 1007. [Abstract] [Full Text] [PDF] |
||||
|
|
J. GONZALEZ-ASTORGA and G. CASTILLO-CAMPOS Genetic Variability of the Narrow Endemic Tree Antirhea aromatica Castillo-Campos & Lorence, (Rubiaceae, Guettardeae) in a Tropical Forest of Mexico Ann. Bot., May 1, 2004; 93(5): 521 - 528. [Abstract] [Full Text] [PDF] |
||||
|
|
J. LOPEZ-PUJOL, M. BOSCH, J. SIMON, and C. BLANCHE Allozyme Diversity in the Tetraploid Endemic Thymus loscosii (Lamiaceae) Ann. Bot., March 1, 2004; 93(3): 323 - 332. [Abstract] [Full Text] [PDF] |
||||
| ||||||||||||||||||||||||||||||||||||||||||||||||||||||||||
| HOME | HELP | FEEDBACK | SUBSCRIPTIONS | ARCHIVE | SEARCH | TABLE OF CONTENTS |