 |
Research on Our Customers' Needs |
 |
Compact detergents
can do it! |
 |
Part I: The LCA Approach |
 |
 Part I: The LCA approach! Part I: The LCA approach! |
 |
 The Methodology � �How do we go about finding
the environmental benefits?� The Methodology � �How do we go about finding
the environmental benefits?� |
 |
 Life Cycle Assessment (LCA)
The �Cradle to Grave Approach� and how we used it Life Cycle Assessment (LCA)
The �Cradle to Grave Approach� and how we used it |
 |
 What did the LCA tell us? What did the LCA tell us? |
 |
 Looking at the �Cradle to Gate� Looking at the �Cradle to Gate� |
 |
 From the Cradle to Grave Approach From the Cradle to Grave Approach |
 |
 How do P&G detergents rate
in other environmental impact categories? How do P&G detergents rate
in other environmental impact categories? |
 |
 What the LCA shows us What the LCA shows us |
 |
 References References |
 |
Part I: The LCA approach! |
| Slowly but surely, companies are building sustainable development into
their business strategies. New exciting innovative technology has become
important for companies to maintain market share in a highly competitive
arena. Today you the consumer have more choice than ever and can
exercise your right to �environmentally improved� products if you choose.
Laundry detergents have not been omitted from this ideal. During the last
fifteen years, consumers across Europe have seen great changes in the
laundry detergent they use. In the early nineties, we saw the launch of the
then �new� compact detergents versus the traditional �big-box� powders
of before 1988. We then introduced the �super compacts� few years
later. At the time, the introduction of these compact powder detergents
was the result of major technological innovation. These compact products
promised, along with the environmental benefit of smaller packaging and
a reduction in manufacturing waste, the use of fifty percent less detergent
per wash load and better cleaning power. |
 |
 back to top back to top |
 |
The Methodology � �How do we go about finding
the environmental benefits?� |
| To clearly demonstrate how the environmental profiles of laundry
detergents have changed over the last 15 years, we compared three P&G
detergents: traditional powder detergent, compact detergent and super
compact detergent. These were Ariel Regular (1988), Ariel Ultra (1992) and
Ariel Futur (1998). We then utilized two distinct complementary methods.
These were Environmental Risk Assessment and Life Cycle Assessment.
In order to ascertain whether the trends were widespread, we analyzed
products from two countries namely Sweden and the Netherlands. This
summary will discuss the results of Life Cycle Assessment (LCA). |
 |
| In conducting these studies,
we have followed international
guidelines and norms for
lifecycle analysis. |
 back to top back to top |
 |
Life Cycle Assessment (LCA)
The �Cradle to Grave Approach� and how we used it |
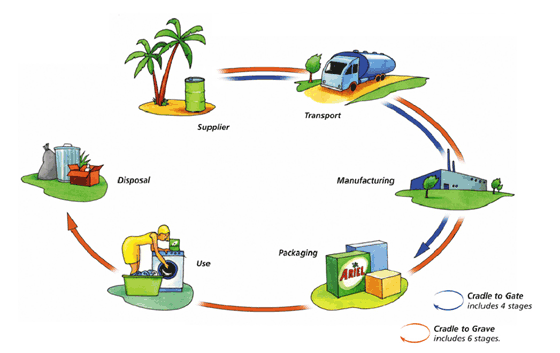
| This
approach looks at the product from its infancy state, which is
analogous to the �cradle� or a �beginning�, to its disposal or end of
life which is metaphorically the �grave�. The stages that were
considered are
identified in the diagram below that consider raw material production,
transport, manufacturing, packaging, the way in which the detergent is
used by the consumer, and the disposal of the detergent and the
packaging after use. We can also look at �cradle to gate� where the LCA
stops at the manufacturing gate and includes packaging. These two
concepts are illustrated in the diagram above. |
 back to top back to top |
 |
What did the LCA tell us? |
| We saw clear improvements for the environment after the introduction
of the compact detergents in 1992 and the super compact detergents in
1998. When we compared them to the traditional �big-box� powders of
1988 the findings were: |
 back to top back to top |
 |
Looking at the �Cradle to Gate� |
 |
 |
Between regular powders and super compacts, there was a 50% decrease in environmental burdens
|
 |
 |
More efficient chemistry in super compacts means less detergent per wash and washing at a lower temperature
|
 |
 |
Less energy used means less CO2 and a reduction in solid waste |
|
 back to top back to top |
 |
From the Cradle to Grave Approach |
 |
 |
The
total energy usage between �big-box� powders of 1988 and the super
compacts of 1998 declined by about 30% in the Netherlands. In contrast,
Sweden saw a decline of 20% of total energy usage. In both countries,
most of these energy savings were a result of a reduction of the
average wash temperature, and less detergent used per wash. |
 |
 |
�There was a distinct
difference between 1998īs
compact detergents and
1988 bigbox powders�
|
 |
 |
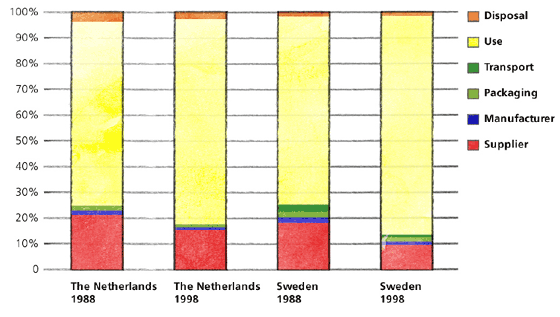
80%
of the overall energy consumption is associated with use of the product
by the consumer when you heat the water and run the washing machine.
Raw material supply accounts for only 15% of the energy and the
remaining 5% of the energy consumption is distributed between the
production and manufacturing process, transportation and disposal. The
same distribution energy patterns were noticed in both Sweden and The
Netherlands (see chart below). |
|
 |
 |
 |
 |
 |
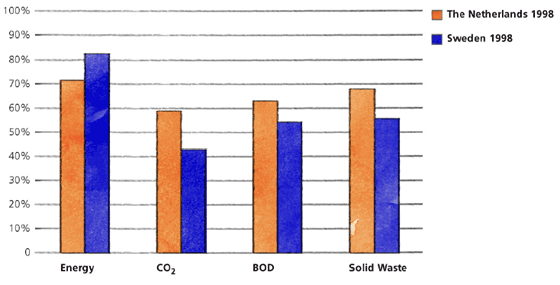
When we looked at the period 1988 to 1998, a clear reduction in
Carbon Dioxide (CO2) emissions were observed in both countries. This is
good news for reducing the Greenhouse Effect. This was as a result of a
decrease in emissions when the consumer washed at lower temperatures.
There was also a smaller reduction observed due to energy savings at the
wastewater treatment plant. This occurred because compacts use less
product to get the same cleaning effect so there is less material to be
treated.
|
 |
 |
Biological Oxygen Demand (BOD) is the amount of oxygen necessary for
all the organic material to decay in the presence of bacteria and protozoa.
Emissions decreased by about 40% in The Netherlands, and by 50% in
Sweden.
|
 |
 |
A 34% reduction in solid waste production in The Netherlands was seen
with a reduction of almost 50% experienced in Sweden. The major sources
of solid waste in this analysis were ash from electricity generation, sludge
from wastewater treatment, and packaging. The 13% difference between
the two countries was a result of more waste-efficient power generation in
Sweden.
|
 |
 |
� Most of the
decreases from 1988
are driven by lower energy
consumption at the use phase
which is due to a lower wash
temperature, a lower dosage
per wash and a corresponding
decrease in environmental
emissions.�. |
|
 |
 |
 back to top back to top |
 |
How do P&G detergents rate
in other environmental impact categories? |
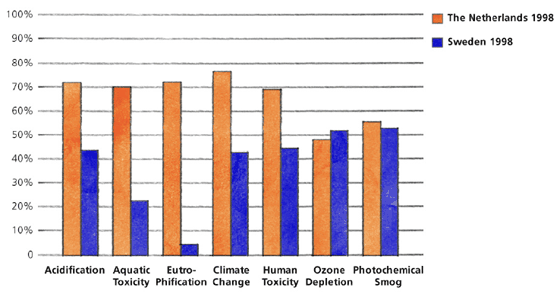
| Among the impact categories we considered were acidification (this is
the production of acid rain and its effects on soil, vegetation, buildings
and waterways), aquatic toxicity, and eutrophication (the over enrichment
of nutrients in lakes and rivers). Also included were the potential climate
change of which the largest component was CO2, human toxicity, and
production of summer smog. For each of these categories, the 1998-super
compact products showed significant improvements when compared to
the 1988-regular �big-box� powder products in both The Netherlands
and Sweden. |
 |
 |
 |
| When we considered the wash cycle in Sweden, there was a lower
environmental impact score across all these categories (except for
ozone depletion). This demonstrates that the laundry process in Sweden
generated fewer emissions over-all. The reason for this is due to the
different method of energy generation which is based on nuclear
production. Another major factor was the water. The water in Sweden
contains less calcium carbonate which is also known to cause �softer�
water. This means that you need a lower dosage of detergent per wash for
the same cleaning power. |
 back to top back to top |
 |
What the LCA shows us |
| Use of energy and environmental emissions such as air, water and solid
waste decreased significantly. Impact categories including acidification,
aquatic toxicity, greenhouse effects, eutrophication, human toxicity, ozone
depletion and smog were also reduced This was as a direct result of the
use of more efficient chemistry which results in a lower recommended
dosage and better wash performance for the super compacts of 1998
when compared to the �big-box� of 1988. Both The Netherlands and
Sweden saw reductions in energy consumption and a reduction in the
other impact environmental categories. Some differences were observed
between the two countries were caused by: |
 |
 |
 |
Different electrical generation in Sweden.
|
 |
 |
Different energy consumption during consumer use. The Dutch consumer
used more energy.
|
 |
 |
Softer� water in Sweden which results in less product used per wash.
|
 |
 |
More efficient wastewater treatment infrastructure in Sweden.
|
|
| It should be emphasized that the majority of the energy consumption
and associated emission came from the use phase of the lifecycle. This
means that �how� we use detergent products has more environmental
effect than which product we choose. With this in mind, we have to
provide consumers with relevant usage instructions, and try to develop
improvements that lead to lower wash temperatures, the use of less water,
reduced energy usage, lower dosages, and less packaging. |
 back to top back to top |
 |
References |
Saouter E, White P (2002): Laundry detergents: cleaner clothes and a
cleaner environment. Corporate Environmental Strategy. 9: 40-50
Saouter E, Van Hoof G (2002):
Saouter E, Van Hoof G, Feijtel T C J, Owens J W (2002): The effects
of compact formulations on the environmental profile of north European
granular laundry detergents.
Saouter E, Van Hoof G, Pittinger C A, Feijtel T C J (2001): The effects
of compact formulations on the environmental profile of north European
granular laundry detergents.
|
| |
 |
 |
|
|
