|
|
|
Measuring Earthquakes
|
Q: Where can I buy a Richter
scale?
|
|
A: The Richter scale is not a
physical device, but a mathematical formula. The magnitude of
an earthquake is determined from the logarithm of the
amplitude of waves recorded on a seismogram at a certain
period.
See next question and answer.
For further information, see:
Magnitude
& Intensity Links |
|
Q: How are earthquakes
recorded? How are earthquakes measured? How is the magnitude
of an earthquake determined?
|
|
A: Earthquakes are recorded by a
seismographic network. Each seismic station in the network
measures the movement of the ground at the site. The slip of
block of rock over another in an EQ releases energy that makes
the ground vibrate. That vibration pushes the adjoining piece
of ground and cause it to vibrate and thus the energy travel
out from the EQ in a wave. There are many different ways to
measure different aspects of an earthquake. Magnitude
is the most common measure of an earthquake's size. It is a
measure of the size of the earthquake source and is the same
number no matter where you are or what the shaking feels like.
The Richter scale measures the largest wiggle on the
recording, but other magnitude scales measure different parts
of the earthquake. Intensity is a measure of the
shaking and damage caused by the earthquake, and this value
changes from location to location.
See also the discussion in the Effects
section.
For further information, see:
Magnitude
& Intensity, NEIC
UC
Berkeley Seismo Lab FAQ on Recording Earthquakes
UC
Berkeley Seismo Lab FAQ on Measuring Earthquakes
UC
Berkeley Seismo Lab FAQ on Different
Magnitudes |
|
Q: What are the different
magnitude scales, and why are there so
many?
|
|
A: Earthquake size, as measured
by the Richter Scale is a well known, but not well
understood, concept. The idea of a logarithmic earthquake
magnitude scale was first developed by Charles Richter in the
1930's for measuring the size of earthquakes occurring in
southern California using relatively high-frequency data from
nearby seismograph stations. This magnitude scale was referred
to as ML, with the L standing for local. This is what
was to eventually become known as the Richter
magnitude.
As more seismograph stations were
installed around the world, it became apparent that the method
developed by Richter was strictly valid only for certain
frequency and distance ranges. In order to take advantage of
the growing number of globally distributed seismograph
stations, new magnitude scales that are an extension of
Richter's original idea were developed. These include
body-wave magnitude, mb, and surface-wave magnitude,
Ms. Each is valid for a particular frequency range and
type of seismic signal. In its range of validity each is
equivalent to the Richter magnitude. Because of the
limitations of all three magnitude scales, ML, mb, and Ms, a
new, more uniformly applicable extension of the magnitude
scale, known as moment magnitude, or Mw, was developed.
In particular, for very large earthquakes moment magnitude
gives the most reliable estimate of earthquake size. New
techniques that take advantage of modern telecommunications
have recently been implemented, allowing reporting agencies to
obtain rapid estimates of moment magnitude for significant
earthquakes. |
|
Q: Why are there often
different magnitudes reported for the same
earthquake?
|
|
A:
When an earthquake occurs, the first information that
is processed and relayed is usually based on a small subset of
the seismic stations in the network, especially in the case of
a larger earthquake. This is done so that some information can
be obtained immediately without waiting for all of it to be
processed. As a result, the first magnitude reported is
usually based on a small number of recordings. As additional
data are processed and become available, the magnitude and
location are refined and updated. Sometimes the assigned
magnitude is "upgraded" or slightly increased, and sometimes
it is "downgraded" or slightly decreased.
Sometimes the earthquake magnitude is reported by different
networks based on only their recordings. In that case, the
different assigned magnitudes are a result of the slight
differences in the instruments and their locations with
respect to the earthquake epicenter.
For further information, see:
Measuring
the Size of an Earthquake,
NEIC |
|
Q: What is "moment
magnitude"?
|
|
A: Moment is a physical quantity
proportional to the slip on the fault times the area of the
fault surface that slips; it is related to the total energy
released in the EQ. The moment can be estimated from
seismograms (and also from geodetic measurements). The moment
is then converted into a number similar to other earthquake
magnitudes by a standard formula. The results is called the
moment magnitude. The moment magnitude provides an estimate of
earthquake size that is valid over the complete range of
magnitudes, a characteristic that was lacking in other
magnitude scales.
For further
information, see:
Magnitude
& Intensity, NEIC
|
|
Q: What are the earthquake
magnitude classes?
|
|
A:
Great; M > =8
Major; 7 < =M
< 7.9
Strong; 6 < = M < 6.9
Moderate: 5 <
=M < 5.9
Light: 4 < =M < 4.9
Minor: 3 < =M
< 3.9
Micro: M <
3 |
|
Q: How do you give a Richter
magnitude to earthquakes that occurred prior to the
scale?
|
|
A: For earthquakes that occurred
between about 1890 (when modern seismographs came into use)
and 1935 when Charles Richter developed the magnitude scale,
people went back to the old records and compared the
seismograms from those days with similar records for later
earthquakes. For earthquakes prior to about 1890, magnitudes
have been estimated by looking at the physical effects (such
as amount of faulting, landslides, sandblows or river channel
changes) plus the human effects (such as the area of damage or
felt reports or how strongly a quake was felt) and comparing
them to modern earthquakes. Many assumptions have to be made
when making these comparisons. For example, how do you compare
the shaking for people living in log cabins or tents in the
early 1800's with shaking for people living in high-rise steel
and concrete buildings (with waterbeds!) in the 1990's?
Because different researchers can get widely varying
magnitudes from using different assumptions on how to make
these comparisons, many of the old earthquakes have big
differences in the magnitudes assigned to them. For example,
magnitude estimates for the quakes that occurred near New
Madrid, Missouri in 1811 and 1812 vary from the upper
magnitude 6 range to as high as 8.8, all because of the
choices the researchers made about how to compare the
data.
For further
information, see:
The
Richter Magnitude Scale |
|
Q: When was the first
instrument that actually recorded an earthquake?
|
|
A: The earliest
seismoscope was invented by the Chinese philosopher
Chang Heng in A.D. 132. This was a large urn on the outside of
which were eight dragon heads facing the eight principal
directions of the compass. Below each dragon head was a toad
with its mouth opened toward the dragon. When an earthquake
occurred, one or more of the eight dragon-mouths would release
a ball into the open mouth of the toad sitting below. The
direction of the shaking determined which of the dragons
released its ball. The instrument is reported to have detected
an earthquake 400 miles away that was not felt at the location
of the seismoscope. The inside of the seismoscope is unknown:
most speculations assume that the motion of some kind of
pendulum would activate the dragons.
 |
|
Note: original source of this image is
unknown |
For further information, see:
The
Early History of Seismometry (to
1900) |
|
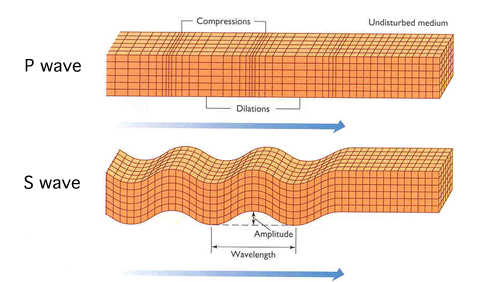
Q: What is a P wave? An S
wave?
|
|
A: When an earthquake occurs, it
releases energy in the form of waves that radiate from the
earthquake source in all directions. The different types of
energy waves shake the ground in different ways and also
travel through the earth at different velocities. The fastest
wave, and therefore the first to arrive at a given location,
is called the P wave. The P wave, or compressional
wave, alternately compresses and expands material in the same
direction it is traveling. The S wave is slower than
the P wave and arrives next, shaking the ground up and down
and back and forth perpendicular to the direction it is
traveling. Surface waves follow the P and S waves.
 |
| Note: original source of this image is
unknown |
|
|
Q: What was the duration of the
earthquake?
|
| A: The duration
of shaking you feel from an earthquake depends in part on the
distance you are from the epicenter of the earthquake. If you
are close, the shaking will be more violent, "faster", and may
not last as long. If you are further away, the high-frequency
"fast" shaking will have been "absorbed" into the earth's
crust, you will feel are the longer-period, more rolling
motions, and they may be of longer duration. In short, the
duration is different in different places.
|
|
Q: What does an earthquake look
like?
|
|
A: In order to study earthquakes,
scientists deploy seismometers to measure ground motion.
Seismograms are recordings of ground motion as a function of
time and are the basic data which seismologists use to study
the waves generated by earthquakes. These data are used to
study the earthquakes themselves and to learn more about the
structure of the Earth.
Seismologists generally describe
earthquakes as local, regional, or teleseismic. These terms
refer to distance from the earthquake to the recording
instrument. Local events occur within the immediate area less
than 100km away. Regional events occur within 10 - 1400km
away. Teleseismic events are those which occur at great
distances, greater than 1400km away. Local and regional
earthquakes are dominated by crustal waves, i.e., by waves
which propagate through the crust. At greater distances, the
seismic wavefield is dominated by waves which sample the body
of the earth - the upper mantle, the lower mantle, and the
core.
Earthquake Examples:
Local or Near-Field
Earthquake
Regional Earthquake
Teleseismic Earthquake
 |
|
Q: How do seismologists locate
an earthquake?
|
|
A:When an earthquake occurs, one
of the first questions is "where was it?" The location may
tell us what fault it was on and where damage (if any) most
likely occurred.
Unfortunately, the earth is not
transparent and we can't just see or photograph the earthquake
disturbance like meteorologists can photograph clouds. When an
earthquake occurs, it generates an expanding wavefront from
the earthquake hypocenter at a speed of several kilometers per
second.
We observe earthquakes with a network of
seismometers on the earth's surface. The ground motion at each
seismometer is amplified and recorded electronically at a
central recording site. As the wavefront expands from the
earthquake, it reaches more distant seismic stations.
When an earthquake occurs, we observe
the times at which the wavefront passes each station. We must
find the unknown earthquake source knowing these wave arrival
times. Here is a map of U.S. Geological Survey seismic
stations in the San Francisco Bay Area and 6 seismograms from
an earthquake:
We want to find the location, depth and
origin time of an earthquake whose waves arrive at the times
measured on each seismograms. We want a straightforward and
general procedure that we can also program in a computer.
The procedure is simple to state: guess
a location, depth and origin time; compare the predicted
arrival times of the wave from your guessed location with the
observed times at each station; then move the location a
little in the direction that reduces the difference between
the observed and calculated times. Then repeat this procedure,
each time getting closer to the actual earthquake location and
fitting the observed times a little better. Quit when your
adjustments have become small enough and when the fit to the
observed wave arrival times is close enough.
You can try to fit an earthquake
location on the map just to see how the procedure goes. Note
that the earthquake arrives first on station C, thus C is a
good first guess for the location. Many earthquakes in
California occur between 2 and 12 kilometers depth and we will
guess a 6 km. depth. The origin time should be a few seconds
before the time of the wave at the first station. Let's guess
an origin time of 10 seconds, measured on the same clock that
made the time scale at the bottom of the figure and timed the
seismograms. Then we can list the tentative travel times by
subtracting the origin time from the observed arrival times:
station..................A      B      C      D      E      F
observed time..........16.5   17.8   11.3   15.2   22.3   18.3
tentative travel time...6.5    7.8    1.3    5.2   12.3    8.3
Note the scale at the left of
the figure. It shows travel times for waves from an earthquake
at a depth of 6 kilometers. The scale starts at 1.3 seconds
because the wave reaches the surface 1.3 seconds after the
earthquake origin time. You can make a tracing of the scale
and move the earthquake on the map until the tentative travel
times match the travel times from the scale. Where do you
think the earthquake was? Are the times for each station
systematically early or late, requiring a shift in the origin
time?
To open a window with the earthquake
location shown on the map, CLICK
HERE.
The earthquake was near station C. The
depth was about 6 km and the origin time was about 10 seconds.
(We guessed very well!) A real magnitude 3.4 earthquake
occurred at this location on April 29, 1992. It was felt by
many people who were sitting or at rest.
Mathematically, the problem is solved by
setting up a system of linear equations, one for each station.
The equations express the difference between the observed
arrival times and those calculated from the previous (or
initial) hypocenter, in terms of small steps in the 3
hypocentral coordinates and the origin time. We must also have
a mathematical model of the crustal velocities (in kilometers
per second) under the seismic network to calculate the travel
times of waves from an earthquake at a given depth to a
station at a given distance. The system of linear equations is
solved by the method of least squares which minimizes the sum
of the squares of the differences between the observed and
calculated arrival times. The process begins with an initial
guessed hypocenter, performs several hypocentral adjustments
each found by a least squares solution to the equations, and
iterates to a hypocenter that best fits the observed set of
wave arrival times at the stations of the seismic network.
|
|
Q: What is intensity? What is
the Modified Mercalli Intensity Scale?
|
|
A: 
The Mercalli Scale is based on
observable EQ damage. From a scientific standpoint, the
Richter scale is based on seismic records while the Mercalli
is based on observable data which can be subjective. Thus, the
Richter scale is considered scientifically more objective and
therefore more accurate. For example a level I-V on the
Mercalli scale would represent a small amount of observable
damage. At this level doors would rattle, dishes break and
weak or poor plaster would crack. As the level rises toward
the larger numbers, the amount of damage increases
considerably. The top number, 12, represents total
damage.
For further information, see:
Modified
Mercalli Intensity Scale
Magnitude/Intensity
Comparison |
|
Q: What is the difference
between intensity scales and magnitude
scales?
|
|
A: Intensity scales, like the
Modified Mercalli Scale and the Rossi-Forel scale, measure the
amount of shaking at a particular location. So the intensity
of an earthquake will vary depending on where you are.
Sometimes earthquakes are referred to by the maximum intensity
they produce. Magnitude scales, like the Richter magnitude and
moment magnitude, measure the size of the earthquake at its
source. So they do not depend on where the measurement is
made. Often, several slightly different magnitudes are
reported for an earthquake. This happens because the relation
between the seismic measurements and the magnitude is complex
and different procedures will often give slightly different
magnitudes for the same earthquake.
For further information, see:
Magnitude/Intensity
Comparison
Modified
Mercalli Intensity Scale |
|
Q: How much energy is released
in an earthquake?
|
|
A:
The total energy from an earthquake includes energy
required to create new cracks in rock, energy dissipated as
heat through friction, and energy elastically radiated through
the earth. Of these, the only quantity that can be measured is
that which is radiated through the earth. It is the radiated
energy that shakes buildings and is recorded by seismographs.
The radiated energy can be obtained in various ways.
Historically, the radiated energy was estimated empirically
from magnitude Ms through the Richter formula, log Es = 4.8 +
1.5Ms, where Es is seismic energy in Joules. In this formula,
magnitude is measured first, after which the formula is used
to obtain Es. With modern instrumentation, energy can be
measured directly from velocity seismograms and converted to a
magnitude. If Es is energy in joules, the energy magnitude Me
is obtained by Me = (2/3) log Es -2.9. If Me is not available,
the seismic moment Mo of an earthquake can provide an
empirical estimate of radiated energy. After Mo is measured,
it is converted to a moment magnitude Mw by Mw = (2/3) log Mo
6.0 where Mo is in Newton-meters (Joules). Mw is then used
as the magnitude in the Richter formula to obtain an estimate
of radiated energy.
[Note that Me and Mw do not
necessarily have the same numerical value because they measure
different physical quantities. Mw is a magnitude that is
derived from low-frequency displacement spectra whereas Me is
measured from higher frequency velocity spectra. Mw is a
measure of the area of rupture and the average slip across the
fault, whereas is Me is a measure of the shaking from an
earthquake.]
Magnitudes and corresponding energy (Joules)
| Magnitude |
Es (from Me) |
Es (from Ms or Mw) |
| 4 |
0.22E+11 |
0.63E+11 |
| 5 |
0.71E+12 |
0.20E+13 |
| 6 |
0.22E+14 |
0.63E+14 |
| 7 |
0.71E+15 |
0.20E+16 |
| 8 |
0.22E+17 |
0.63E+17 |
| 9 |
0.71E+18 |
0.20E+19 |
Once the energy is known in Joules, it can be compared
to the explosive energy of TNT. One ton of TNT has an energy
of 4.2*10E09 Joules.
Magnitudes and corresponding energy (tons of TNT).
| Magnitude |
Es (from Me) |
Es (from Ms or Mw) |
| 4 |
5. |
15. |
| 5 |
169. |
475. |
| 6 |
5330. |
15023. |
| 7 |
168559. |
475063. |
| 8 |
5330293. |
15022833. |
| 9 |
168558672. |
475063712. |
|
|
Q: What is acceleration,
velocity, and displacement?
|
| A: Acceleration
is the rate of change in velocity of the ground shaking (how
much the velocity changes in a unit time), just as it is the
rate of change in the velocity of your car when you step on
the accelerator or put on the brakes. Velocity is the
measurement of the speed of the ground motion. Displacement is
the measurement of the actual changing location of the ground
due to shaking. All three of the values can be measured
continuously during an
earthquake. |
|
Q: What is spectral
acceleration?
|
|
A: PGA (peak acceleration) is
what is experienced by a particle on the ground. SA is
approximately what is experienced by a building, as modeled by
a particle on a massless vertical rod having the same natural
period of vibration as the building.
For further information see:
Natl. Seismic
Hazard Mapping Program FAQ |
|
Q: What are those beachball
figures?
|
|
 A: In addition
to determining the location and magnitude of earthquakes,
seismologists are now routinely determining the "fault plane"
solutions or "focal mechanisms" of events. A fault plane
solution illustrates the direction of slip and the orientation
of the fault during the earthquake. These solutions, which are
displayed in lower-hemisphere projections frequently described
as "beachballs", can be determined from the first-motion of
P-waves and from the inversion of seismic waveforms. These
figures help identify the type of earthquake rupture:
strike-slip, normal, or thrust. Strike-slip earthquakes are
typical of the San Andreas fault zone, which forms part of the
boundary between the North American and Pacific plates. Normal
earthquakes are associated with extension, particularly with
formation of plates at mid-ocean ridges. Thrust or reverse
earthquakes are associated with compression, particularly with
the subduction of one plate under another as in Japan. (UC
Berkeley) A: In addition
to determining the location and magnitude of earthquakes,
seismologists are now routinely determining the "fault plane"
solutions or "focal mechanisms" of events. A fault plane
solution illustrates the direction of slip and the orientation
of the fault during the earthquake. These solutions, which are
displayed in lower-hemisphere projections frequently described
as "beachballs", can be determined from the first-motion of
P-waves and from the inversion of seismic waveforms. These
figures help identify the type of earthquake rupture:
strike-slip, normal, or thrust. Strike-slip earthquakes are
typical of the San Andreas fault zone, which forms part of the
boundary between the North American and Pacific plates. Normal
earthquakes are associated with extension, particularly with
formation of plates at mid-ocean ridges. Thrust or reverse
earthquakes are associated with compression, particularly with
the subduction of one plate under another as in Japan. (UC
Berkeley)
For further information see:
Focal
Mechanisms |
|
Q: What are UTC and GMT (in
reference to the time of an EQ)?
|
|
A: UTC stands for Coordinated Universal Time,
and GMT stands for Greenwich Mean Time. The time that
earthquakes occur around the world is reported in UTC or GMT,
which are essentially the same.
For further information see:
Time
Information - from NEIC |
|
Q: What does it mean that the
earthquake occurred at a depth of 0 km?
|
|
A: An earthquake cannot occur at depth of 0 km. In
order for an earthquake to occur, two blocks of crust must
slip past one another, and it is physically impossible for
this to happen at the surface of the earth. So why do we
report that the earthquake occured at a depth of 0 km
sometimes? Sometimes it is simply a very shallow event with
poor depth resolution, but more often it is not actually an
earthquake, but a quarry blast. These explosions are recorded
by the seismic network and located by the software. When they
are reviewed by a seismic analyst, they are labaled as a
quarry blast in the earthquake
catalog. |
Back to Earthquake
FAQ Main page
| |
