
Geography 483:Problem Solving with GIS
Lesson 3-Project3 Locating Tornado Relief Sites
by Judy S. Parker
Tornadoes can occur in many parts of the world, however,
they are most frequent during the Spring in the central United States. Each year
an average of 800-1000 tornadoes are reported nationwide resulting in many
deaths and injuries.
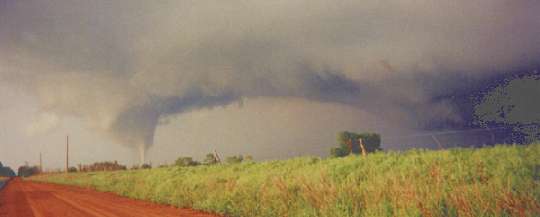
On May 3, 1999, multiple super-cell thunderstorms
produced many large and damaging tornadoes in central Oklahoma during the late
afternoon and evening hours. Some of these storms were killers, including the
twisters that moved through and/or near Dover, Shawnee, Perry and Bridge Creek,
and the Moore and southern Oklahoma City metropolitan areas. Additional
tornadoes also hit areas in south-central Kansas, eastern Oklahoma and northern
Texas, with approximately 74 tornadoes being observed across the region. The
current tornado count makes this outbreak the largest ever recorded in Oklahoma.
The May 3rd twisters in Oklahoma resulted in 48 deaths and 795 people
injured. Many homes, farms and businesses were damaged or destroyed throughout
the affected areas with a total damage estimate near one billion
dollars.
The subject of this project was the same as Project2, a large
tornado disaster across 17 counties in Oklahoma on May 3, 1993. The last
project dealt with damage analysis for the counties involved in the
outbreak. For this project the task was to analyze the data and display
possible relief sites for the rescue effort of the tornadoes aftermath.
Some of the same data from Project 2 will be used for this project, however
Project 3 is a follow-up in which emergency relief sites will be found based on
a buffer created around the actual paths of the tornadoes.
Project Overview:
1. Perform table
manipulations.
2. Insert buffer zones around line and area layers.
3.
Perform attribute and spatial queries.
4. Perform union and intersect
overlay operations.
5. Create thematic maps to summarize various aspects of
the data.
Projection:
NAD_1983_StatePlane_Oklahoma_North_FIPS_3501_Feet
Projection:
Lambert_Conformal_Conic
False_Easting: 1968500.000000
False_Northing:
0.000000
Central_Meridian: -98.000000
Standard_Parallel_1:
35.566667
Standard_Parallel_2: 36.766667
Latitude_Of_Origin: 35.000000
Ellipsoid: GRS 80
GCS_North_American_1983
(Information taken from Lessons 2& 3 of GEOG483)
Source: National Severe Storms Laboratory NOAA
For emergency planners, GIS can facilitate critical decision
making before a disaster strikes and in the crucial early stages of disaster
relief operations. The goal is to develop timely, accurate, and relevant
geospatial information that can be easily interpreted by a plethora of end users
for a wide range of disaster relief functions. One of the focuses of this
project is to prioritize areas in need of relief efforts by analyzing a
combination of tornado strength (F_scale) and the number of potential victims
(PopDense), that way, areas in greater need can be attended to first. It makes
sense to say that F1 tornadoes (weakest) in densely populated areas have more
the potential of damage and destruction than F5 tornadoes in sparsely populated
areas. Both factors need to be taken into consideration.
In order to perform the proper analysis on the information, manipulation the data in the tables by adding fields and joining, unioning, and intersecting tables was performed. This was necessary since some of the tables were represented spatially and some were not. This called for adding fields and joining tables, thus allowing for analysis on some of the information from tables that were not represented spatially.
The next step was to create a layer (TornBuff) to represent the paths the tornadoes took This was then buffered with a 1 mile buffer which represents the Emergency Relief Zones (ERZTemp) for the rescue and emergency help for after the tornadoes. Next a join of the Tornadoes table to ERZTemp to create ERZTemp2, which represents the emergency relief zones with the attributes of the tornadoes joined to it. Next a union was done with ERZTemp2 and the tornado paths (TornBuff) to create Emergency Relief Zones (Emerg_rel_zones) for the tornadoes. The next step was to remove the tornado path areas (TornBuff) from the Emergency Relief Zones because any emergency relief zones in the path of the tornado would probably have been destroyed or damaged.
A query for the possible locations (hospital, school, or church) for emergency relief sites from the OKPlaces layer (a layer that represents building types and their point locations) was preformed to single out the possible candidates. The candidate relief sites (CandidateReliefSites) (hospital, school, or church) that fell within the Emergency Relief Zones (Emerg_rel_zones) were then selected as the final relief sites.
To prioritize the relief effort on a county specific scale, the county data (CountiesNew) was intersected with the Emergency Relief Zones (Emerg_rel_zones) to create subdivisions along county boundaries. This enables emergency relief priority on a county by county basis to easily recognize which counties were in greater need. Relief priority zones (ReliefPriorityZones) were created to incorporate relief priority as a function of the F-scale of each tornado and population density in each county. Priority 1 representing the highest priority level (high F-scale in a densely populated county) and priority 5 representing the lowest priority level (low F-scale and a sparsely populated county).
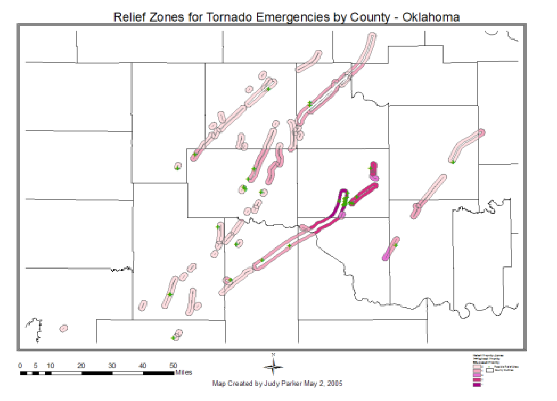
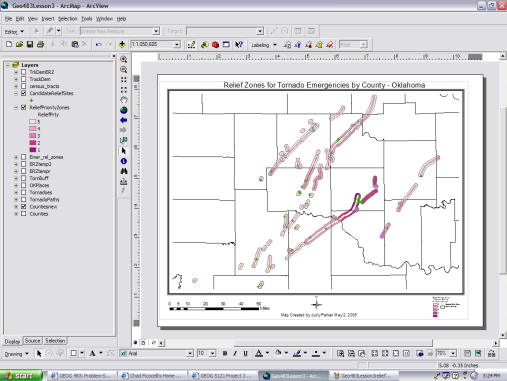
The following graphics are an exported map and a screenshot (which includes the table of contents) of the buffered areas around the tornado paths and the potential Relief Sites. The buffers are thematically mapped to show a graduation in color of the areas that are in need of Emergency Relief Sites. The zones are shown that the darker the pink (scale of 1) the more need the area is of emergency action. Of course the lighter the pink (scale increases in number to 5) the lesser the need for emergency action. These results show the buffered areas 1 mile around the actual width of the tornado path. This is used to find the possible relief sites for the tornado victims. The buffer (a varying value based on the width of each individual path) is field BuffDist is calculated by dividing the tornadoes path width in the tornadoes database by 2. Each buffer has a hole cut out of it that shows us the path of the tornado. This was done to show the assumption that any potential relief facilities in this area are more than likely destroyed and cannot be considered as a relief site for this project. Unioning the buffers around the tornado paths (tornbuff) the Emergency Relief Zone (erztemp2) and deleting all of the overlaps (the tornado paths themselves-tornbuff) leaves you with the areas around the paths that have potential for relief sites that are closest to the areas of need. Once the appropriate point locations of the sites are queried from within these areas gives you the best location for potential relief sites. The potential Relief Sites are marked by points in green. These were the schools, hospitals and churches we queried out earlier.
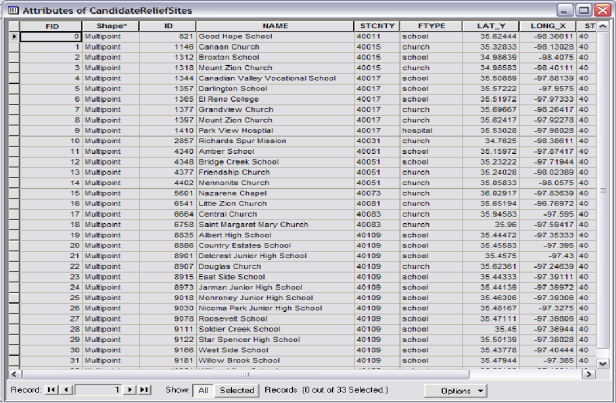
The following screenshot is of the potential Relief Sites in the area of the tornadoes damage. The Name column was used in the next graphic to label the sites on the map.
The limitations of this analysis include the fact that the population data used was on a county-wide basis. Localized population density may vary greatly within the counties and emergency relief zones themselves. A more localized data source, such as census tract is done in the Try This section and is more accurate for this type of analysis. These smaller spatial features would give a more concise depiction of the actual fluctuations in population density throughout the outbreak area. The density of the county cannot be assumed as consistent throughout the county. This is why greater detail of demographic data would be necessary. Census Tracts data from the US Census bureau gives us a larger scale idea of the individual areas of the counties that would need to focus on a relief effort.
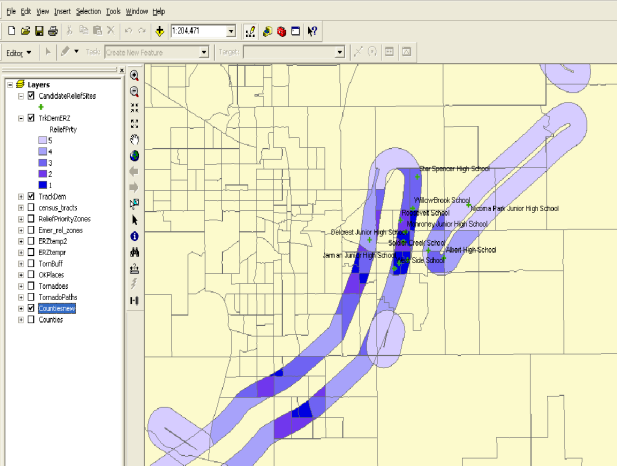
Try This!
The final map is showing a zoomed in example of new Relief Priority Zones based on Census Tracts and population density. The darker the blue the greater need for relief action is necessary. The potential Relief Sites are located in the areas of need and are marked with green points and labeled by name. Showing the analysis at this level gives a better understanding of the areas in need more than showing it on a county wide basis.
The other considerations that need to be pointed out include logistic considerations (911 response routes, availability of accessing areas if roads are damaged); police, ambulance and fire stations around the area available for emergency response and possible aid stations; and possible influx of supply vehicles arriving from other non-damaged populated areas. Perhaps the expansion of the possible site lists to include clinics, doctors offices and veterinarian offices. Also, you would need to assess the areas for locations of schools and nursing homes that may have been struck. This would call for greater need of emergency action as the elderly and school children would require more care in this situation. Demographic data such as high trafficked areas would also be necessary to know what kind of response is necessary. If you are dealing with an area that could possibly have a high density at certain point of the day, that are not considered in the housing density demographic (business parks, malls, amusement parks etc) could change the way you respond to the areas.
|
Sources : |
|
Data provided by GEOG483 instructor (except census data)(2005). http://cms.psu.edu/ Accessed 2 May 2005. U.S. Census Bureau (2005). http://www.census.gov Accessed 2 May 2005. Maps created from ArcView 9.x. National
Severe Storms Laboratory NOAA http://www.nssl.noaa.gov/teams/swat/Cases/990503/StormBG.html
National Severe Storms Laboratory NOAA http://www.nssl.noaa.gov/researchitems/tornadoes.shtml Accessed 2 May 2005.
|