|
|
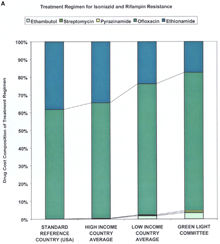
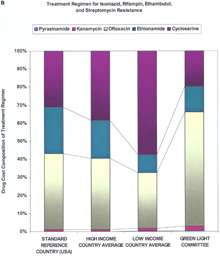
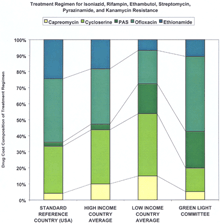
Supplementary MaterialDetailed Methodology for Decreasing the Cost of Second-Line Drugs 1) Perform a market analysis. The first step was to identify all manufacturers of second-line drugs. The market status of second-line drugs fell into three categories: monopoly status as patent holder, monopoly status without a patent, and multiple manufacturers. Identification of the market status for each drug allowed the identification of distinct negotiation strategies. Four drugs---capreomycin, cycloserine, ofloxacin/ciprofloxacin and para-aminosalicylic acid (PAS)---comprised the greatest source of expenditures for treatment regimens recommended for MDR-TB cases resistant to two, four, and six drugs (Web fig. 1, A, B, and C, respectively; and see Web table 1 and Fig. 1 in Science Express and in print). All four were under monopoly production status, although only one class of drugs---the fluoroquinolones (ofloxacin/ciprofloxacin)---was, and still is, under patent protection (in certain countries). Depending on the setting, single drugs may contribute variable costs. For negotiations, it was key to determine what drugs composed the majority of costs, as such prioritization led to the greater price reductions. All manufacturers were screened for quality assurance. 2) Unify the approach to the industry. The second and paramount step was to unify all the individual efforts to the industry under one negotiating body. In situations where numerous negotiating bodies compete for the same products, prices are often higher because multiple sources of demand compete for a limited supply. Médecins Sans Frontières (MSF) represented all potential buyers associated with the Working Group, and, thus, was positioned to negotiate lower prices as a single source of demand. Transfer/MSF is the agent for the initial 2000 patients and the International Dispensary Association (IDA) Foundation is designated to continue the procurement beyond the initial 2000. 3) Establish a market. The largest problem regarding price was lack of competition. The four highest-priced drugs were under monopoly production status, and the prices of the other drugs could still be lowered. Demonstrating the existence of a market and introducing economies of scale were the next steps in selecting negotiation strategies. Six categories of the most important second-line drugs were submitted for inclusion on the WHO Model List of Essential Drugs (EDL). Inclusion on the WHO EDL affords local health authorities increased capacity to raise awareness of the disease among government officials and facilitates in-country registration of the drug (1). Also, the generic drug industry often takes greater notice of EDL drugs as agents with a potential global market. The six categories were placed under the "reserve anti-infective agents" category to help ensure that they would be used only under established programmatic guidelines (2). The second procedure of demonstrating the existence of a market was to quantify the global demand for second-line drugs. We identified two quantifiable markets for the drugs. The first market consisted of the identified countries and organizations making firm financial and programmatic commitments to establishing pilot projects. This yielded approximately 2000 patients (constituting over three million doses of the various drugs) in total. The second market was a mix of the estimated number of new cases globally with MDR-TB and the estimated global consumption of second-line drugs by national tuberculosis public health programs (NTPs) not yet involved in the DOTS-Plus initiative but planning to become involved in the near future. New global estimates from WHO indicate the number of new MDR-TB cases in 2000 was between 207,000 and 338,000 (3). A recent WHO survey has also estimated the global consumption of each second-line drug by NTPs from over 20 countries. This second market remains a growing one because of the decreasing cost of second-line drugs, thereby allowing more NTPs to have access to drugs they could not previously afford, and because of the increasing number of identified cases. 4) Select negotiation strategies. For all drugs a direct negotiation strategy based upon a quantifiable single source of demand for 2000 patients was utilized. Donations were not considered, in order to provide a reference price and incentive for new manufacturers to enter the market. In order to induce competition in monopoly markets and to sustain the low prices achieved by direct negotiations, the projections in demand were incorporated to serve as basis for a "tiered-tender" approach. This approach does not grant the entire tender contract to the company with the lowest-priced, quality-assured product, but rather gives a large percentage (for example, 50%) to the manufacturer with the lowest-priced, quality-assured product, and a proportional percentage (for example, 20 to 30%) to a select number of the remaining manufacturer (or manufacturers) with quality-assured product(s). If this tiered tender is restricted to only manufacturers participating in the quality-assurance process (i.e., having a prequalification scheme based upon quality assurance), then the negotiating body can also guarantee high-quality products. The result would be increased competition and decreased prices (via economies of scale) coupled with high-quality drugs. However, this approach is most effective when companies do not engage in price collusion. By definition, this approach does not immediately result in the absolute lowest price, but should yield lower prices in the long term. Our experience to date has demonstrated relatively minor differences in the absolute lowest price and the prices generated by tiered-tendering (4). 5) Show advantages for the industry. One of the challenges of the Working Group was to demonstrate to industry members that participating in a pooled procurement process would be advantageous for them. For one monopoly producer from the research-based pharmaceutical industry, sales of second-line drugs represented a very small proportion of total sales. For this company, participation in the pooled procurement process represented an opportunity to demonstrate its commitment to increasing access to life-saving medications in developing countries. For one member of the generic drug industry, collaboration with WHO represented an opportunity for the company to be involved in a type of high-profile partnership that had traditionally involved the research-based pharmaceutical industry, permitting them to penetrate international markets previously untouched. A second advantage presented to manufacturers was the formation of a technical committee [known as the Green Light Committee (GLC)] that would provide access to concessionally priced drugs to those DOTS-Plus projects judged to be technically sound. Supplying concessionally priced drugs to projects validated by the GLC provided the industry and the public health community with assurances that the drugs were being properly used, thus minimizing the chance of generating further resistance. The industry was asked only to sell these concessionally priced drugs to GLC-approved projects and not on the open market. This would not only prevent other poorly organized projects from benefiting from the concessional prices, but it would also induce projects to comply with appropriate scientific standards (again, minimizing the chance of generating further resistance). Although the industry could not be bound to this agreement, WHO strongly encouraged compliance, because random use of second-line drugs could lead to an increase of "super MDR-TB" (MDR-TB also resistant to second-line drugs). In addition, resistance to second-line drugs in a given area also eliminates the utility of those drugs, thereby eliminating the market for the drugs. A third advantage for the industry was the offer, in some cases, to help facilitate registration of drugs, including waivers of possible tariffs and duties. The fourth advantage (primarily for the research-based industry) was that single-source demand allowed for industry to adjust manufacturing facilities and production capacity for scheduled long-term production, rather than having to respond to irregular, sporadic requests (which leads to higher prices). Web table 2 reflects the present pricing structure of the second-line drugs in multiple countries. Overall, high-income countries are paying (on average) higher unit costs for most second-line drugs in comparison with low-income countries. The range of decrease in prices (compared with the high and low income country average price) via the GLC price was from 38.13% to 98.45%. Ciprofloxacin prices decreased primarily because of the expiration of the patent (in many countries), and similar effects are projected for ofloxacin once its patent expires. The unit prices of PAS and kanamycin are projected to decrease further to US$0.40 and US$0.11, respectively, in 2002 upon the introduction of an additional manufacturer for each drug; and, the price of ofloxacin should decrease (in a fashion similar to ciprofloxacin) to US$0.08 upon the expiration of patent in 2002 (4). Small differences between Web table 2 and Table 1 in Science Express and in print are the result of rounding before and after the calculations.
Supplemental Figure 1. Cost composition of treatment regimens. The drug-by-drug cost for each of the drugs used in a treatment regimen for MDR-TB patients with resistance to two (A), four (B), or six (C) drugs. Ofloxacin is the single greatest contributor to the cost for all three regimens, both in terms of the reference price and the GLC price.
Figure 1A
Medium version | Full size version
Medium version | Full size version
Medium version | Full size version
Volume 293, Number 5532, Issue of 10 Aug 2001, p. 1049. Copyright © 2005 by The American Association for the Advancement of Science. All rights reserved. |
||||||||||||||||||||||||||||||||||||||||||||||||||||||||||||||||||||||||||||||||||||||||||||||||||||||||||||||||||||||||||||||||||||||||||||||||||||||||||||||||||||||||||||||||||||||||||||||||||||||||||||||||||||||||||||||||||||||||||||||||||||||||||||||||||||||||||||||||||||||||||||||||||||||||||||||||||||||||||||||||||||||||||||||||||||


